Essential Statistics Websites
 Available in US
The gap between recreational bettors and profitable ones often comes down to research quality. While casual punters rely on intuition, headlines, and basic form tables, serious Brighton bettors access detailed statistical databases that reveal patterns invisible to surface-level analysis. The right combination of free and premium statistics websites transforms betting from guesswork into informed decision-making.
This guide covers the essential platforms for researching Brighton matches, explaining what each site offers, how to use it effectively, and how different sources complement each other to build comprehensive match analysis.
FBRef: The Comprehensive Statistical Database
FBRef stands as the most thorough free football statistics resource available. Powered by StatsBomb data, it provides exhaustive player and team statistics that support detailed Brighton analysis.
The site’s Brighton team page displays season-long statistics across multiple categories: standard stats, shooting, passing, pass types, goal and shot creation, defensive actions, possession, and miscellaneous data. Each category breaks down into granular metrics that reveal how Brighton actually play rather than how results suggest they play.
For Brighton betting, the shooting section proves particularly valuable. You can see not just goals scored but expected goals, shots per match, shots on target percentage, and goals per shot. These figures inform over/under goals betting by revealing whether Brighton’s recent goal output reflects sustainable chance creation or variance.
The passing data illuminates Brighton’s build-up play. Progressive passes, passes into the final third, and passes into the penalty area quantify their attacking intent. High figures suggest goals should follow even during scoring droughts.
FBRef allows comparison across seasons, helping identify whether current Brighton performance represents improvement, decline, or consistency. The player-level data supports props betting by revealing individual shot volumes, chance creation, and other marketable statistics.
The site’s greatest strength for bettors lies in its data export functionality. You can download tables into spreadsheets for custom analysis, building your own models or tracking specific metrics over time.
Understat: Expected Goals Specialisation
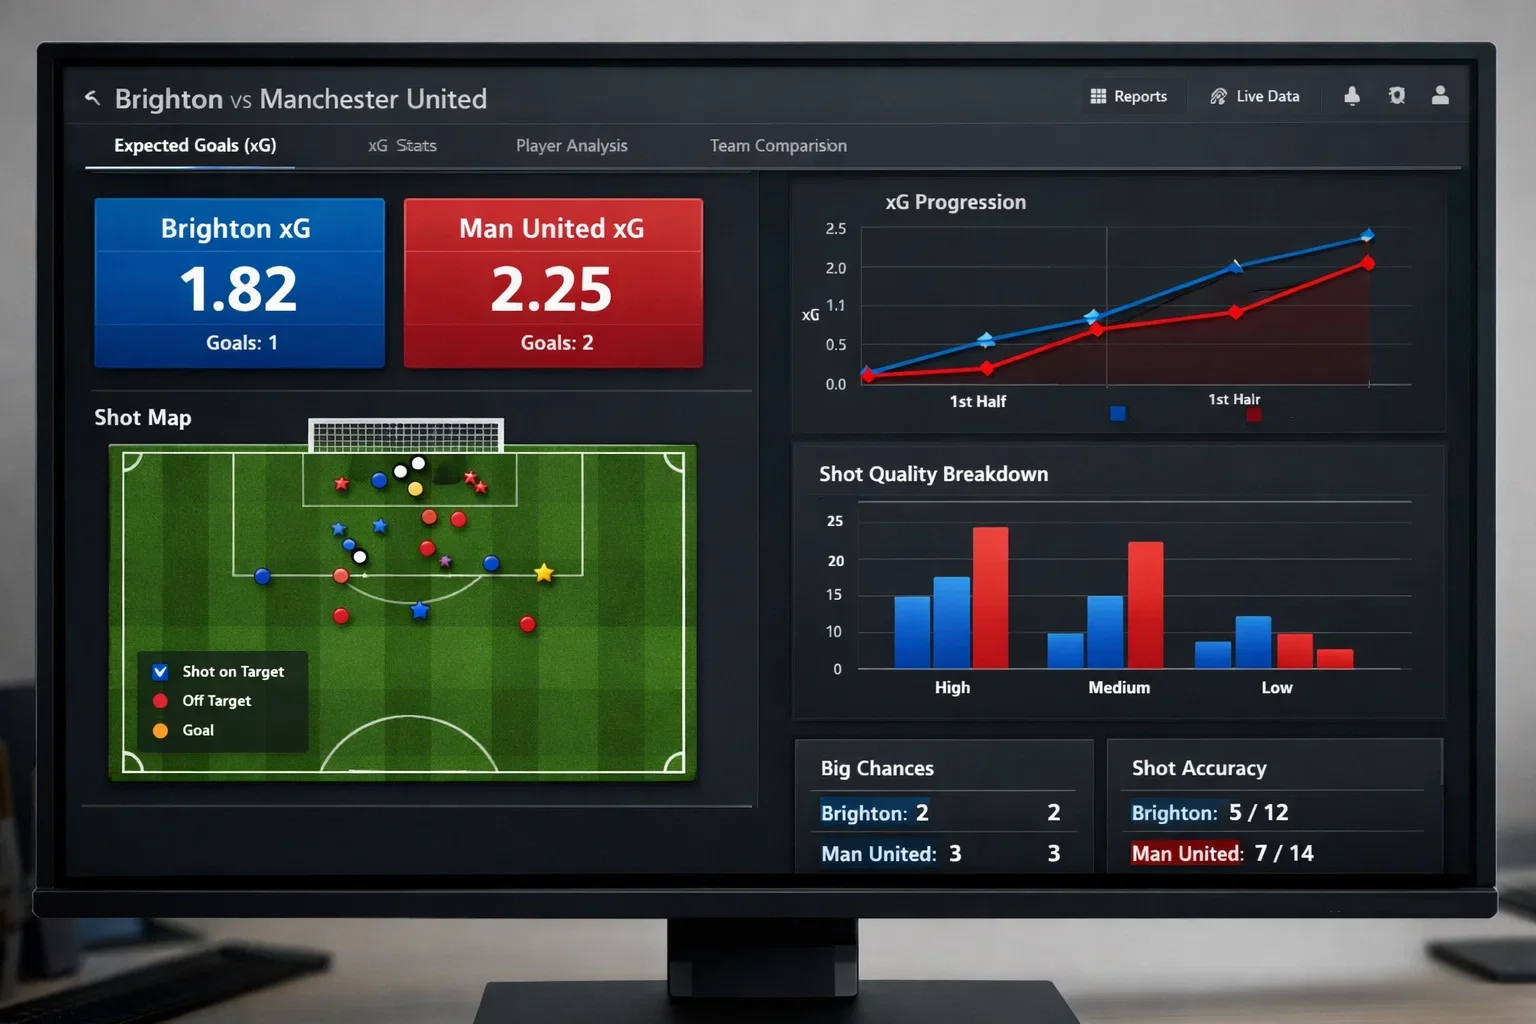
Understat focuses specifically on expected goals analysis, providing the cleanest xG data presentation available. The site covers major European leagues including the Premier League, making it essential for Brighton xG research.
The Brighton team page displays match-by-match xG figures, rolling averages, and season totals. You can quickly identify whether recent results reflect underlying performance by comparing actual goals to expected goals. Large divergences suggest regression opportunities.
Shot maps for each Brighton match show exactly where chances arose. These visualisations reveal whether Brighton’s xG comes from high-quality central chances or lower-quality efforts from distance. The distribution matters because central chances convert more reliably than peripheral ones.
Player-level xG data supports goalscorer betting. You can see which Brighton attackers are overperforming or underperforming their expected goals, informing anytime scorer and first goalscorer market decisions.
Understat’s expected points (xP) data extends xG analysis to league table implications. Brighton’s xP figure shows where they should sit based on underlying performance rather than actual results. Discrepancies between actual and expected points suggest future results should differ from recent ones.
The site is completely free, with a clean interface that makes data accessible without overwhelming users. It complements FBRef by providing specialised xG analysis that the broader database doesn’t emphasise as strongly.
FootyStats: Market-Specific Research
FootyStats organises statistics around betting markets rather than general performance metrics. This orientation makes it particularly useful for identifying specific betting opportunities.
The site’s Brighton page displays over/under goals percentages, BTTS rates, corners statistics, and cards data. Each metric comes with home and away splits, allowing venue-specific betting adjustments.
The league-wide comparison tools reveal where Brighton rank across various metrics. You can identify whether their 71% over 2.5 goals rate represents a league-leading figure or merely average performance. These rankings inform how aggressively to back Brighton-specific markets.
Head-to-head data for upcoming opponents shows historical patterns between specific matchups. While past results don’t determine future outcomes, recurring patterns between particular opponents can inform betting decisions.
FootyStats offers both free and premium tiers. The free version provides substantial useful data, while premium unlocks additional statistics, predictions, and corner/card data that recreational bettors might not need but serious analysts value.
The match search functionality allows filtering upcoming fixtures by statistical criteria. You can find all Brighton matches where combined team averages suggest over 2.5 goals, streamlining research for specific betting angles.
Sofascore and Flashscore: Live Data and Lineups
While primarily live score services, Sofascore and Flashscore provide pre-match data that supports Brighton betting decisions.
Lineup information appears earlier on these platforms than official sources, allowing bettors to assess team news before markets fully adjust. Brighton’s rotation under Fabian Hurzeler makes lineup information particularly valuable because starting XI significantly affects expected performance.
The match centre pages display basic statistics, recent form, and head-to-head records. While less detailed than specialist sites, the presentation is clean and accessible for quick pre-match checks.
Live statistics during matches support in-play betting. Shot counts, possession figures, and corner totals update in real-time, helping identify when match flow differs from scoreline implications.
Player ratings aggregate individual performance assessments, though these subjective measures carry less betting value than objective statistics. They’re useful for identifying standout performers but shouldn’t drive betting decisions.
Both platforms are free with mobile apps that provide push notifications for Brighton matches. The combination of quick access and real-time updates makes them useful supplements to deeper statistical research.
WhoScored: Player Ratings and Tactical Analysis
WhoScored combines statistical data with analysis and player ratings. The site’s algorithm generates performance scores that, while subjective, attempt to quantify individual contributions.
Brighton’s tactical analysis pages describe their playing style using data-driven categories. These descriptions help understand what statistics to prioritise when researching specific opponents.
The player statistics include detailed passing, shooting, and defensive data. Comparison tools allow evaluating Brighton players against league peers, identifying relative strengths and weaknesses.
Form tables show recent performance across various metrics, not just results. A Brighton team winning matches but generating fewer chances than opponents displays different underlying form than one dominating statistically while results disappoint.
The site’s predictions provide match forecasts based on their analytical models. While no prediction model guarantees accuracy, comparing WhoScored’s assessments against your own analysis helps identify potential blind spots.
Infogol: Live xG and Shot Quality
Infogol specialises in expected goals with particular strength in live match analysis. Their shot maps and live xG updates provide real-time insight into how matches are actually flowing beneath the scoreline.
For Brighton betting, Infogol’s pre-match xG predictions help calibrate expectations. Their model estimates expected goals for and against, providing benchmarks against which to assess market odds.
The live xG tracker during matches shows whether Brighton are creating quality chances regardless of the scoreline. A team dominating xG while trailing represents different live betting opportunity than one lucky to remain level.
Post-match xG analysis confirms or challenges interpretations of results. Understanding whether Brighton’s victory was deserved or fortunate affects how to interpret their subsequent odds.
Building Your Research Workflow

Effective Brighton betting research combines multiple sources rather than relying on any single platform.
Begin with FBRef for comprehensive baseline statistics. Understand Brighton’s current performance across all measurable categories before focusing on specific markets.
Use Understat to assess xG trends and identify regression opportunities. Compare actual versus expected figures to determine whether recent results accurately reflect underlying performance.
Consult FootyStats for market-specific data. Their orientation toward betting markets directly informs stake decisions.
Check Sofascore or Flashscore for lineup news and quick pre-match verification. Team news affects expected performance significantly.
Review WhoScored for tactical context and player comparisons. Understanding how Brighton’s approach matches up against specific opponents improves market selection.
Monitor Infogol for live match xG during games. In-play betting decisions benefit from real-time underlying performance assessment.
Avoiding Information Overload
The abundance of available data creates risk of analysis paralysis. Not every statistic matters for every betting decision.
For match result betting, focus on xG, form, and head-to-head data. Team-level performance metrics matter more than individual player statistics.
For goals markets, prioritise xG averages, defensive statistics, and opponent profiles. Whether Brighton score depends more on chance creation than individual finishing rates.
For player props, concentrate on individual shot volumes, chance creation, and minutes played. Team-level statistics matter less than personal output.
Select the sources that inform your specific betting interests rather than attempting to master every available platform. Depth in relevant areas beats breadth across irrelevant ones.
The statistics websites detailed here provide the data foundation for informed Brighton betting. Combining their insights with match-specific analysis and disciplined bankroll management creates the research infrastructure that separates profitable bettors from hopeful speculators.
