Building Your Own Brighton Betting Model
 Available in US
Profitable betting requires systematic analysis that goes beyond intuition and headline form. Building a personal betting model for Brighton matches provides structured framework for probability assessment, forcing explicit consideration of factors that casual analysis overlooks. Even simple models improve decision quality by ensuring consistent analytical process.
This guide presents a practical framework for Brighton match analysis that you can implement without advanced statistical training or programming skills.
What a Betting Model Does
A betting model converts information about an upcoming match into probability estimates for various outcomes. These probabilities then compare against bookmaker odds to identify value.
If your model estimates Brighton’s win probability at 55% but bookmakers offer odds implying 48% (around 2.08 decimal odds), your model suggests value exists. If your estimate matches or falls below implied probability, the bet offers no value regardless of whether Brighton actually win.
The model doesn’t need to be mathematically complex. Structured, consistent analysis that considers relevant factors provides value even without sophisticated algorithms.
Core Model Components
An effective Brighton betting model considers several categories of information.
Recent Form Metrics
Track Brighton’s performance across recent matches using statistics rather than results alone. Key metrics include:
Expected goals for and against (xG and xGA) over the last 5-10 matches. These figures better represent performance than actual goals.
Shots and shots on target, both created and conceded. Volume indicates attacking and defensive activity levels.
Possession percentage, particularly home versus away splits. Brighton’s possession profile shapes match expectations.
Big chances created and conceded. These high-quality opportunities predict goals more reliably than total shots.
Opposition Assessment
Apply similar analysis to Brighton’s upcoming opponent:
Their recent xG profile reveals attacking and defensive capability.
Their tactical approach determines how the match will flow. Possession teams create different dynamics than counter-attacking teams.
Their home/away splits might reveal significant venue effects.
Their injury situation affects available quality.
Head-to-Head Patterns
Historical meetings between Brighton and specific opponents sometimes reveal persistent patterns:
Some teams consistently struggle against Brighton’s style regardless of general form.
Some opponents have tactical approaches that historically trouble Brighton.
Venue-specific records might indicate persistent advantages.
Weight recent head-to-head results more heavily than historical patterns, but don’t ignore recurring themes.
Contextual Factors
Situational elements affect probability beyond pure football quality:
Fixture timing within the season and week. Congestion effects, motivation levels, and seasonal patterns matter.
Team news including injuries, suspensions, and expected rotation.
External factors including weather forecasts and venue conditions.
Building Probability Estimates
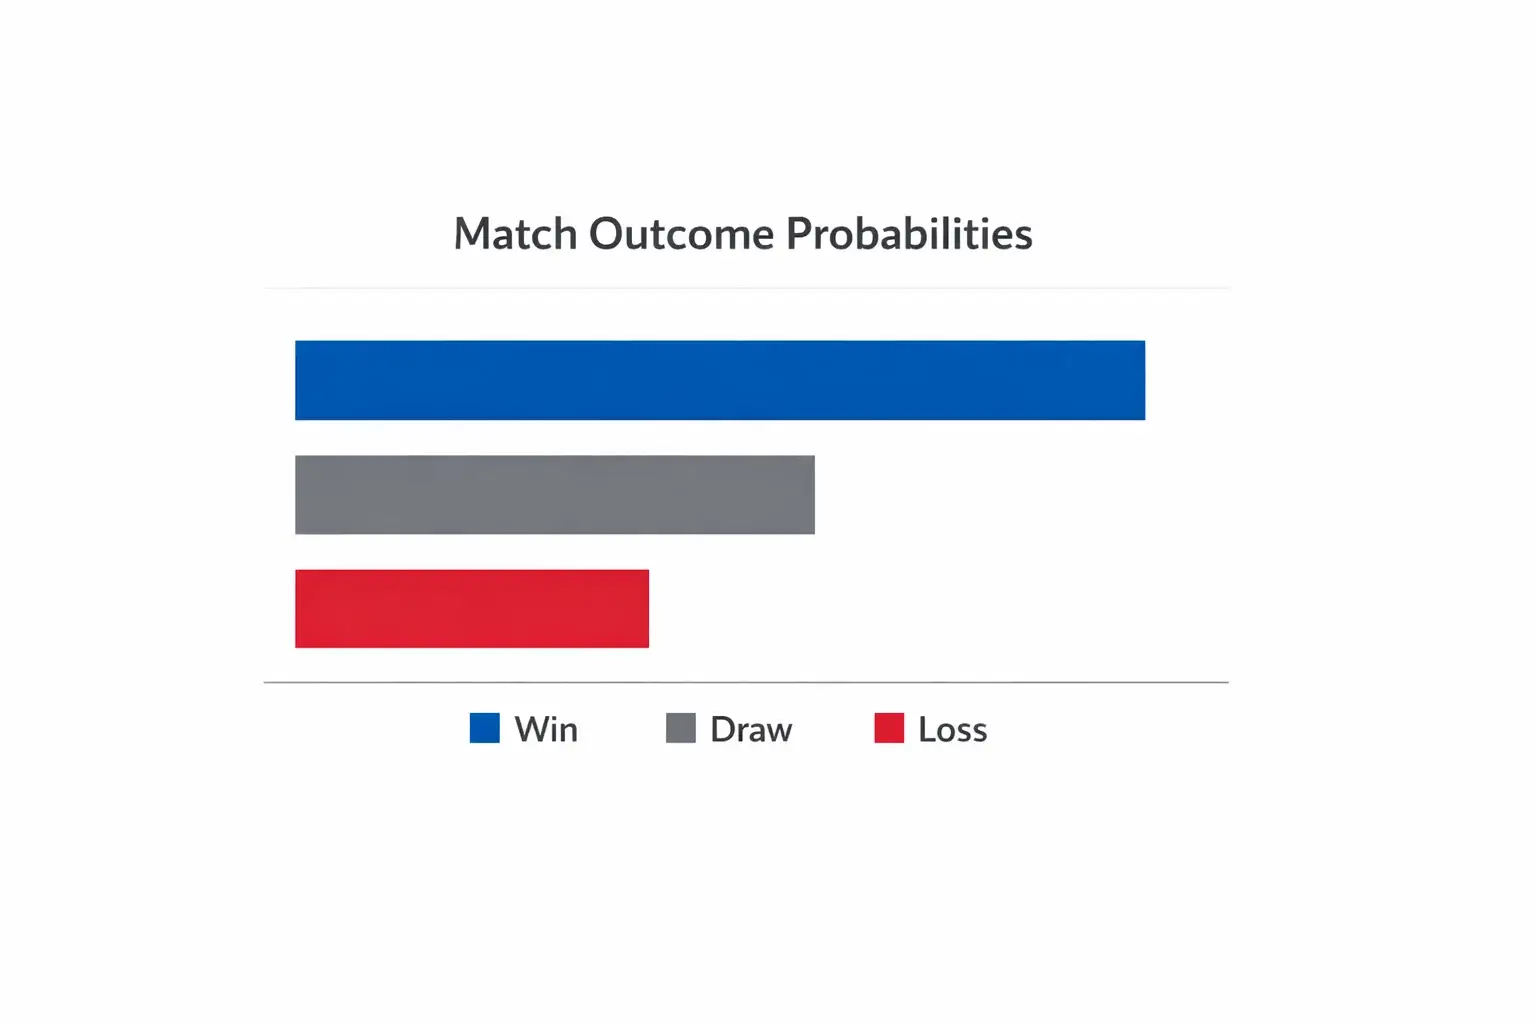
Convert your analysis into numerical probability estimates. This forces precise thinking and enables comparison against market odds.
Start with a baseline derived from league position and general quality assessment. Brighton as an established top-half Premier League team might have baseline home win probability around 45-55% against typical mid-table opponents.
Adjust from baseline based on your analysis:
Strong recent Brighton form (positive xG, creating chances): increase win probability by 5-10%.
Opponent struggling (negative xG, defensive vulnerabilities): increase Brighton win probability by 5-10%.
Adverse conditions (away fixture, travel, rotation expected): decrease win probability by 5-10%.
The specific adjustments require calibration over time. Track your predictions against actual outcomes to refine how much weight each factor deserves.
Calculating Value
Once you’ve estimated probabilities, calculate whether available odds offer value.
Convert decimal odds to implied probability: Implied Probability = 1 / Decimal Odds.
For Brighton at 2.00 odds, implied probability = 1/2.00 = 50%.
Compare your estimated probability to implied probability. If your estimate exceeds implied probability, value exists.
Calculate expected value: EV = (Your Probability × Potential Profit) – (1 – Your Probability × Stake).
For a £10 bet on Brighton at 2.00 odds when you estimate 55% probability:
EV = (0.55 × £10) – (0.45 × £10) = £5.50 – £4.50 = £1.00 positive expected value.
Only bet when expected value is positive. Passing on bets where value doesn’t exist, regardless of outcome likelihood, is essential to profitable betting.
To populate your model, use the essential statistics websites we recommend.
Tracking and Refinement
Your model improves through systematic tracking of predictions against outcomes.
Record every analysis including your probability estimates, the odds available, whether you bet, and the actual outcome. This documentation enables performance review.
Calculate your prediction accuracy over time. If you estimate 60% probabilities for a category of bets but they win only 50% of the time, your estimates are systematically too high for that category.
Identify which factors you weight correctly and which you misjudge. Perhaps you overweight recent form or underweight fixture congestion. Data reveals these biases.
Refine weightings based on evidence. Adjust how much various factors shift your probability estimates based on what actually predicts outcomes.
Simple Implementation of a Brighton Betting Model
You don’t need spreadsheets or software to implement this model. A consistent mental checklist works for many bettors:
What do Brighton’s last five xG figures show?
What do the opponent’s last five xG figures show?
What does head-to-head history suggest?
What contextual factors affect this specific match?
What is my probability estimate for Brighton win/draw/loss?
What odds are available?
Does value exist?
Writing down your analysis before checking odds prevents anchoring bias where you adjust your assessment to match available prices.
Common Pitfalls
Several errors undermine model effectiveness:
Overconfidence in estimates produces value identification where none exists. Stay humble about probability estimation accuracy.
Ignoring base rates leads to extreme probability estimates. Brighton rarely have greater than 70% or less than 20% win probability against Premier League opposition regardless of circumstances.
Confirmation bias causes selective attention to information supporting existing beliefs. Actively seek reasons why your initial assessment might be wrong.
Overfitting to small samples means treating recent results as definitive when they might represent noise. Five matches don’t establish trends; they indicate possibilities requiring further observation.
Neglecting market efficiency. Bookmaker odds incorporate substantial information. Large disagreements between your model and market odds more likely reflect model error than market mistake.
Advanced Development
As your model matures, consider enhancements:
Separate models for different markets. Factors predicting goals markets might differ from factors predicting corners or cards.
Opponent-specific adjustments. Some opponents might systematically trigger model errors, suggesting their characteristics require special handling.
Situational modifiers. Derby matches, end-of-season fixtures, or specific tactical matchups might warrant systematic adjustments.
Integration of additional data including advanced metrics, player-level analysis, or tactical evaluation.
Building a Brighton betting model provides structure that improves decision quality regardless of mathematical sophistication. The discipline of explicit probability estimation and value calculation separates analytical betting from hopeful gambling.
Model Validation
Test your model’s accuracy before trusting it with significant stakes.
Paper trading involves tracking what you would have bet without actually placing wagers. This reveals model performance without financial risk.
Small stake testing uses minimal bet sizes to validate model performance with real-money accountability. Psychological effects of actual betting differ from theoretical tracking.
Sample size requirements mean validation takes time. At least 100 bets, preferably 200+, provide meaningful assessment of model accuracy.
Calibration analysis compares your probability estimates against actual outcomes. If your 70% confidence bets win only 60% of the time, systematic recalibration is needed.
Integrating Multiple Information Sources

Your model improves by combining different analytical perspectives:
Statistical data from sites like FBRef and Understat provides objective metrics.
Tactical analysis from watching matches or reading expert breakdowns adds context that numbers alone miss.
Team news from reliable sources reveals lineup information that affects expectations.
Market movements show what informed betting money believes, providing external validation or contradiction of your analysis.
No single source provides complete information. Triangulating across multiple sources improves overall accuracy.
When to Override Your Model
Sometimes qualitative factors warrant departing from model output:
Breaking news about injuries or tactical changes might not be incorporated into your standard analysis.
Unique circumstances like player farewells, managerial appointments, or extraordinary motivation might affect probabilities beyond model capture.
Model limitations become apparent when certain match types consistently produce errors. Recognise where your model struggles and apply appropriate caution.
Override decisions should be rare and documented. If you frequently override your model, the model needs refinement rather than regular exception.
Improve your ROI using our betting resource hub.
