Expected Goals (xG) for Brighton Betting
 Available in US
The revolution in football analytics centres on a single metric: expected goals, abbreviated as xG. This statistical measure has transformed how professionals evaluate team and player performance, moving beyond the deceptive simplicity of final scorelines to measure the true quality of chances created. For Brighton bettors, understanding xG provides analytical edge that separates informed wagering from hopeful speculation.
Brighton represent a particularly instructive case study for xG application. Their possession-based approach generates numerous shooting opportunities, while their high defensive line concedes chances through counter-attacks. The tension between these tendencies creates xG profiles that reveal far more than match results about their true performance level.
This guide introduces xG concepts specifically through Brighton’s lens, explaining what the metric measures, how to interpret it, and most importantly, how to apply it to betting decisions.
What Expected Goals Actually Measures
Expected goals assigns a probability value to every shot taken in a football match. A penalty receives approximately 0.76 xG because historical data shows penalties convert around 76% of the time. A header from six yards out might carry 0.30 xG. A long-range effort from 25 yards might register just 0.03 xG.
The calculation considers multiple factors: distance from goal, angle of the shot, whether the chance came from open play or set piece, the type of assist preceding the shot, whether the shooter used their foot or head, and the positioning of defenders between shooter and goal. More sophisticated models incorporate goalkeeper positioning and even game state.
A team’s match xG represents the sum of all their individual shot xG values. If Brighton take fifteen shots with individual xG values totalling 2.3, their match xG is 2.3. This figure represents how many goals an average team would score from those exact chances, providing a standardised measure of chance quality.
The power of xG lies in separating chance creation from chance conversion. A team might score three goals from 0.8 xG worth of chances, suggesting exceptional finishing or fortunate bounces. Another team might score zero goals from 2.5 xG worth of chances, suggesting poor finishing or an outstanding goalkeeper. xG reveals which team actually performed better regardless of the scoreline.
Brighton’s xG Profile
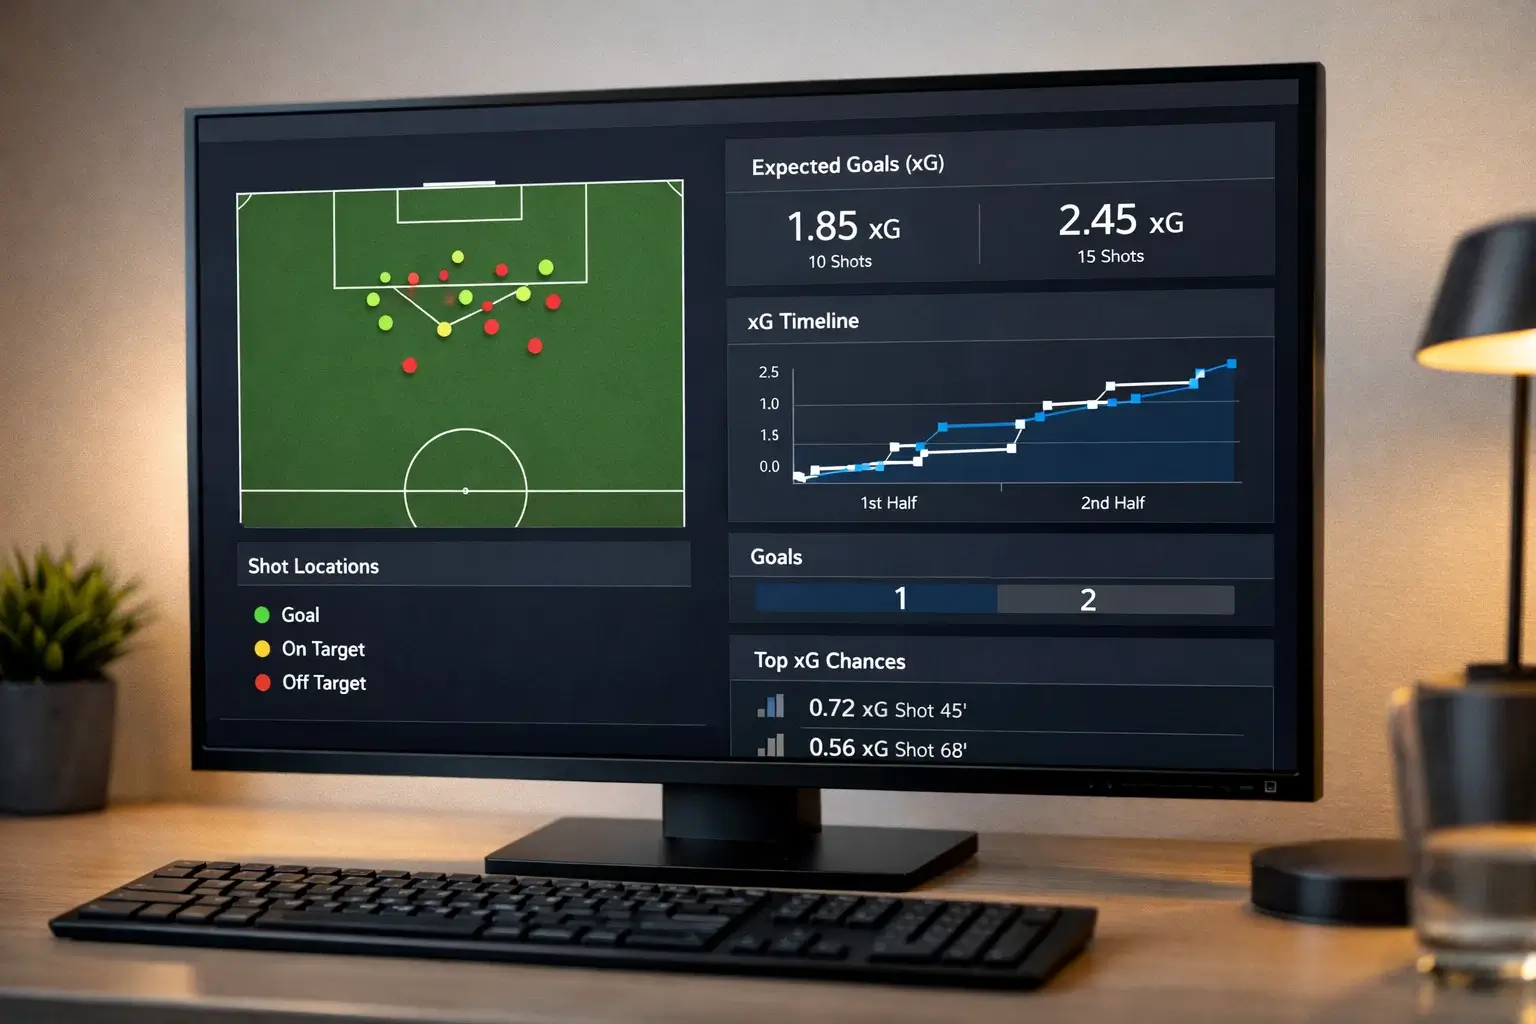
Brighton’s 2024-25 Premier League campaign produced xG figures that illuminate their true performance level beyond raw results. Their xG For (the chances they created) reached 58.7 across the season, while their xG Against (the chances they conceded) totalled 54.6. This positive xG differential of approximately 4 goals suggests they created more quality chances than they conceded.
However, Brighton actually scored 66 goals while conceding 59, meaning they slightly outperformed their xG at both ends. This outperformance could indicate genuinely superior finishing ability, could reflect opponent goalkeeping misfortune, or could represent variance that might regress in future seasons.
The match-by-match xG data tells more nuanced stories. Brighton frequently dominated xG against weaker opponents, creating 2.0+ xG while conceding under 1.0. Against elite opposition, the xG balance shifted toward parity or slight disadvantage. Against counter-attacking teams, Brighton often posted high xG For figures while also conceding elevated xG Against due to their high line vulnerability.
Using xG to Evaluate Form
xG provides more stable form assessment than results alone because it removes the variance inherent in small goal totals. A team that creates 2.5 xG but loses 0-1 hasn’t necessarily performed poorly. Their finishing failed or their opponent’s goalkeeper excelled, but their underlying chance creation suggests future goals will come.
Brighton’s form assessment through xG helps identify when results mislead about performance. During their winless run either side of Christmas 2024, Brighton’s xG figures remained strong despite disappointing results. They created chances at rates suggesting goals would eventually arrive. Bettors who recognised this underlying quality found value in backing Brighton at enhanced prices that reflected poor results rather than poor performance.
Conversely, when Brighton’s xG figures decline even during winning periods, caution becomes appropriate. Winning matches through exceptional finishing or opponent errors isn’t sustainable long-term. The underlying chance creation (or lack thereof) predicts future results more reliably than current scorelines.
xG for Goals Market Betting
Expected goals directly inform over/under goals betting because they measure the expected goal output from each team’s chances.
If Brighton’s recent xG For averages 1.8 per match and their opponent’s xG Against averages 1.6, you might expect Brighton to create chances worth approximately 1.7 goals. Combined with opponent offensive capabilities, this informs total goals predictions.
The adjustment from xG to actual goals matters because finishing quality varies. Brighton’s attackers might convert chances at above-average rates, meaning their actual goals could exceed xG predictions. Monitoring whether Brighton are currently over or underperforming their xG helps calibrate goals market expectations.
xG can also identify matches where over or under goals markets offer value. If two teams consistently generate high combined xG but bookmakers price over 2.5 goals based on lower actual goal totals (due to poor finishing), value exists in the over. The underlying chance creation suggests goals should arrive even if recent finishing has disappointed.
xG for BTTS Betting
Both Teams to Score probability connects directly to xG Against figures. If Brighton typically concede chances worth 1.2 xG per match, their opponents have realistic goal probability regardless of opponent identity. The chances exist; only finishing determines whether they convert.
Brighton’s BTTS profile derives from their dual nature: creating high xG through possession and conceding meaningful xG through high-line vulnerability. This combination produces BTTS outcomes at elevated rates because both teams generate genuine chances.
When evaluating specific matches, compare Brighton’s recent xG Against with their opponent’s recent xG For. If Brighton have been conceding 1.0+ xG per match while facing an opponent creating 1.5+ xG per match, BTTS probability increases. If Brighton have been defensively solid (low xG Against) against an opponent struggling to create (low xG For), BTTS probability decreases.
xG for Match Result Betting
Match result betting benefits from xG analysis because it reveals which team is truly performing better despite scoreline noise.
If Brighton have been creating significantly more xG than they’ve been scoring, they’re likely due positive regression, where finishing returns to normal levels and goals arrive. Backing Brighton after periods of underperformance relative to xG can offer value when markets overweight disappointing results.
If Brighton have been scoring significantly more than their xG suggests, caution becomes appropriate. The finishing might be unsustainable, and future results might disappoint as conversion rates normalise. Avoiding Brighton or backing opponents during these periods protects against regression to the mean.
Where to Find xG Data
Understat offers free, detailed xG data including match-by-match figures, player-level xG, and shot maps showing where chances arose. Their interface allows comparing teams across seasons and identifying trends.
FBRef provides comprehensive xG statistics as part of their broader analytical database. They offer expected assists (xA) alongside xG, providing fuller pictures of team attacking contribution.
Infogol specialises in xG data presentation for betting purposes, including pre-match xG predictions and live in-match xG updates that help identify when actual match flow differs from underlying chance creation.
Opta powers many commercial xG implementations, though direct Opta access requires subscription. Many bookmakers and media outlets use Opta-derived xG figures.
Use xG data to identify potential Brighton xG regression before the market reacts.
Common xG Misconceptions

Several misunderstandings about xG limit its usefulness if not addressed.
xG doesn’t predict exact goal totals. A team with 2.3 xG didn’t definitely deserve two goals. They created chances that, on average across thousands of similar situations, would produce 2.3 goals. Individual match variance around this expectation remains substantial.
xG doesn’t account for all factors affecting goal probability. Player skill, fatigue, tactical adjustments during matches, and psychological pressure don’t feature in most xG models. Brighton’s Kaoru Mitoma might convert low-xG chances at elevated rates because his finishing exceeds league average. xG provides useful baseline expectations, not precise predictions.
Single-match xG figures carry more noise than multi-match samples. Brighton generating 3.0 xG against one opponent tells you less than Brighton averaging 1.8 xG across ten matches. Larger samples smooth out variance and reveal true performance levels.
Practical Application of xG in Match Analysis
Effective xG-informed Brighton betting combines the metric with other analytical tools.
Before each Brighton match, check their recent xG For and xG Against figures. Are they creating quality chances? Are they conceding them? How do these figures compare to their actual goals scored and conceded?
Compare Brighton’s xG profile against the specific opponent. Do opponent tendencies suggest Brighton’s xG figures will maintain, increase, or decrease? Counter-attacking opponents might inflate both xG For and xG Against. Possession opponents might suppress both figures.
Identify any regression opportunities. Has Brighton been underperforming their xG, suggesting goals will come? Have they been overperforming, suggesting caution about backing them at short prices?
Use xG as one input among many rather than a sole decision driver. Tactical matchups, team news, motivation, and market pricing all matter alongside xG in producing profitable betting decisions.
Expected goals has revolutionised football analysis by separating chance creation from chance conversion. For Brighton bettors, understanding xG provides stable form assessment, regression identification, and goals market insight that surface-level results analysis cannot match.
Master the mathematics of our Seagulls betting platform.
